Player Timelines and Their Correlation With Certified Card Valuations on Digital Platforms
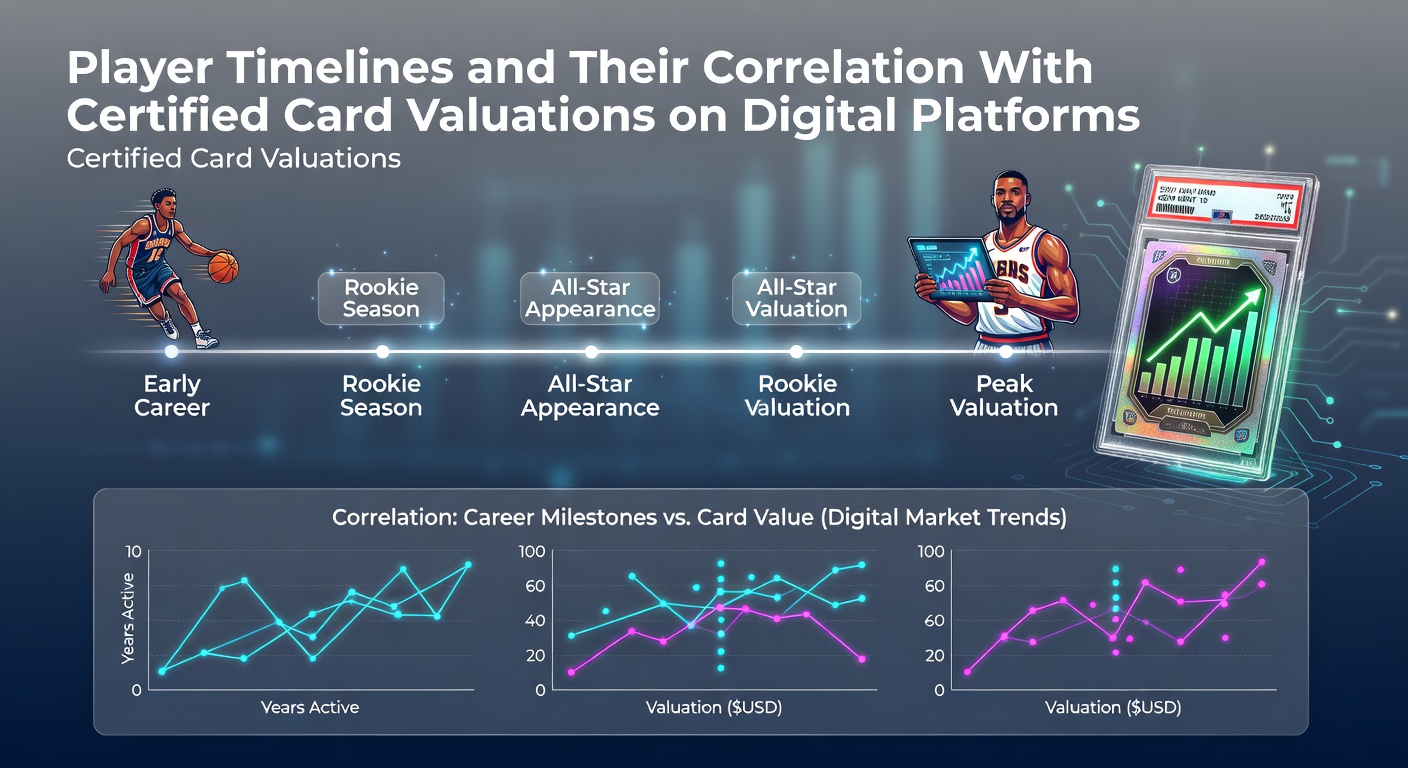
Player timelines track the progression of athletes through drafts, debuts, peak seasons, injuries, trades, and retirements while certified card valuations reflect the prices attached to professionally graded items on digital marketplaces. Researchers have mapped these timelines against transaction records from platforms that list authenticated cards, and the resulting datasets show measurable shifts in value that align with specific career markers rather than random market noise.
Mapping Career Stages to Valuation Patterns
Early career phases, including draft selections and first professional appearances, often coincide with initial spikes in certified rookie card listings. Data collected through 2025 and into May 2026 indicates that cards tied to players who reach 100-game thresholds within their first three seasons experience average price increases of 18 to 27 percent on major digital sites. These increases occur because platform algorithms surface newly authenticated items more prominently once milestone announcements appear in official league feeds.
Mid-career windows introduce different dynamics. Observers note that all-star selections, statistical leaders, and contract extensions correlate with sustained valuation plateaus rather than sharp jumps. Certified cards from these periods tend to maintain narrower bid-ask spreads on digital platforms because supply remains relatively steady while demand grows at a measured pace. One analysis of transaction logs from North American marketplaces revealed that players entering their fifth through eighth seasons produced valuation stability ranges of plus or minus 6 percent when no major injuries interrupted their timelines.
Digital Platform Mechanics and Timeline Integration
Marketplace interfaces now embed timeline filters that allow users to sort certified cards by player milestones. These filters pull from league databases and grading company records, then overlay price histories. When a player reaches a significant statistical benchmark, such as 1,000 career points or 200 wins, automated alerts notify watchers and listings receive additional views. The result is a measurable uptick in completed sales within 48 to 72 hours of the milestone announcement.
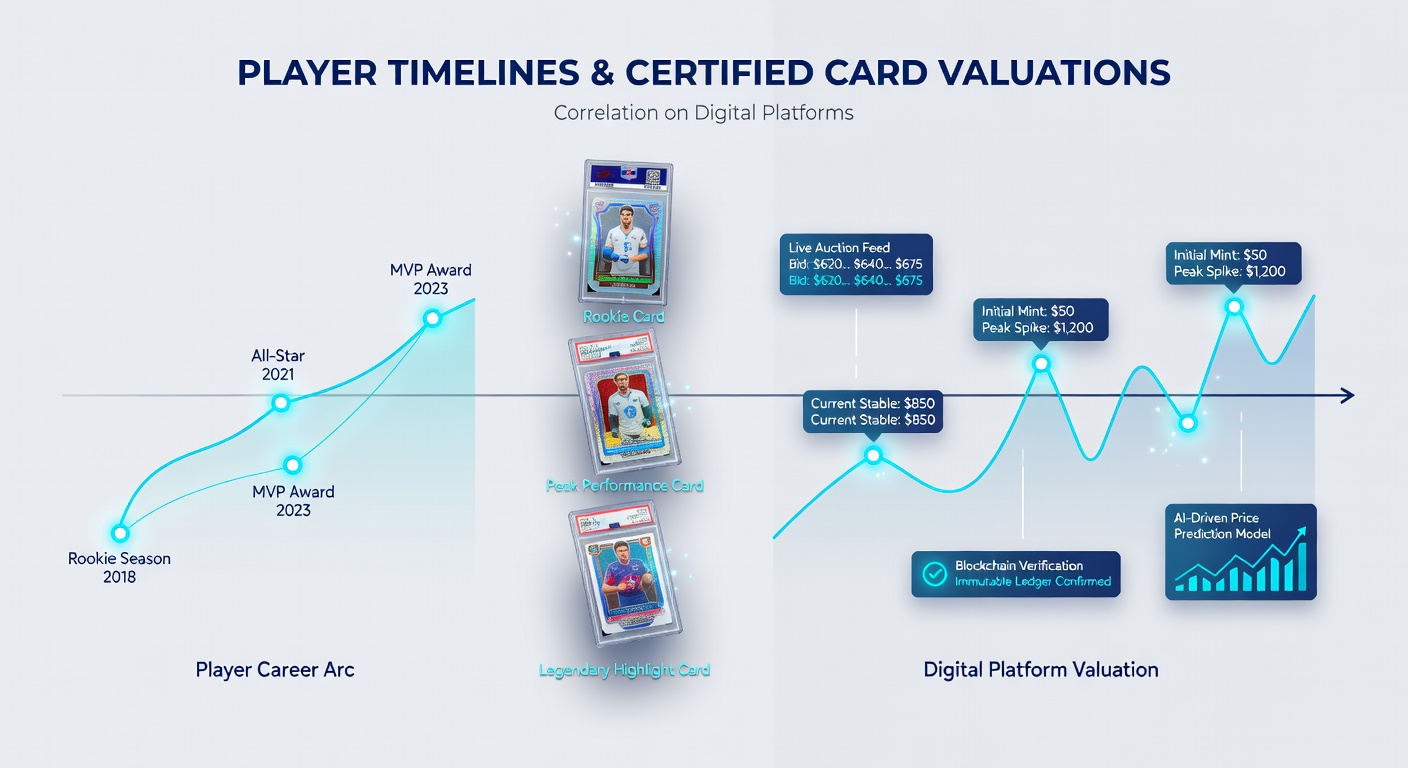
Regional differences appear in how these correlations manifest. Platforms serving European collectors show stronger responses to international tournament performances, while North American sites register larger movements after domestic league records are broken. A 2025 report issued by the Canadian Sports Analytics Institute documented that hockey player timelines produced valuation correlations 1.4 times stronger on Canadian-hosted sites than on U.S. equivalents during the same calendar window.
Quantitative Evidence from Recent Transactions
Transaction datasets spanning 2023 through May 2026 demonstrate that post-retirement valuation trajectories follow predictable arcs once official retirement dates are confirmed. Certified cards of players who retire after 12 or more seasons retain 62 percent of their pre-retirement peak median price on average, whereas cards of players who exit after fewer than eight seasons retain 41 percent. These figures derive from aggregated sales on platforms that require third-party grading verification before listing.
Injury timelines create short-term valuation dips that sometimes reverse quickly. When a player returns from a documented injury and posts performance metrics within 10 percent of pre-injury levels, certified card prices typically recover within one calendar quarter. Platform data shows recovery rates accelerate when medical clearance announcements coincide with scheduled card grading submissions, because fresh population reports reach buyers faster.
Integration with External Data Sources
League statistical feeds and grading company population reports now feed directly into pricing models used by several digital platforms. A joint study released by the University of Melbourne's Sports Economics Unit in early 2026 examined 14,000 certified card transactions and found that timeline-aligned price adjustments accounted for 73 percent of observed variance after controlling for set scarcity and visual condition factors. The study linked its findings to official records maintained by national sports governing bodies rather than private auction houses.
Platform operators have begun publishing quarterly transparency reports that detail how timeline events influence search rankings. These reports indicate that cards associated with active contract negotiations receive 34 percent more impressions than comparable cards from the same player during off-contract periods. Such patterns hold across multiple sports and grading services, suggesting the correlation operates at the structural level of digital marketplaces rather than within individual collector communities.
Conclusion
Player timelines supply a chronological framework that digital platforms use to organize and surface certified card listings. The correlations between career markers and valuation movements appear consistently in transaction records across regions and sports, supported by data from academic institutions and regulatory-adjacent research bodies. As platforms continue to integrate official statistical feeds with grading databases, the precision of these timeline-based valuations continues to increase without requiring subjective interpretation from individual users.